Number of new school operating levies lower than past highs
Jul 31, 2014
Some big government advocates claim that reductions in state education funds have caused an increase in the number of local levies for new school operational funds over the past four years. Janetta King, president of left-leaning Innovation Ohio, has argued that such reductions have “pushed the need for tax increases down to the local level where middle and low income Ohioans are being asked to hike their own property taxes in order to make up the shortfall.” But a broader view of Ohio’s recent history with school levies suggests that taxpayers should look for a different culprit.
Innovation Ohio recently reported a 14 percent increase in the number of new school operating levies between May 2007-May 2010 and May 2011-May 2014, leading to a 34% increase in approved school operating revenue. Unfortunately, these numbers don’t tell us much without further context.
First, the Innovation Ohio report neglects to note that approximately half of the increase in approved school operating revenue flows from a massive levy passed in 2012 as part of the Cleveland schools reform plan. Second, Innovation Ohio fails to account for Ohio’s Great Recession, which dominated the first period of study. To be sure, the understandable (and wise) reluctance to enact new tax increases during a prolonged recession predictably led to fewer proposed levies in the first period. The latter period of the study, however, from 2011 to 2014, shows a slow, but steady recovery. Third, the study’s limited time period does not tell us if a 14 percent increase is shocking or expected. Indeed, the Buckeye Institute’s own analysis demonstrates, for example, that a 14 percent increase in school operating levies pales in comparison to the 140 percent increase seen between 1999-2002 and 2003-2006.
A more complete picture on the number of levies was provided by the Education Tax Policy Institute (ETPI) in 2007, and offers a fuller context for understanding Ohio’s current levies. The ETPI report compiled and analyzed every school operating levy in Ohio from 1994-2006, and found that the number of levies decreased each year from 1994 to 1998, but then increased each year from 2001 to 2004. The chart below, showing only new operating levies, illustrates the trend.
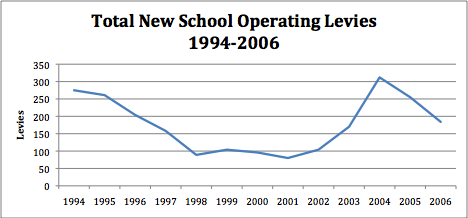
As shown here, considered in the context of the past twenty years, the reduction in new operating levies from 2007-2010 identified by Innovation Ohio merely continues the trend that began in 2004 and should not be particularly surprising. Furthermore, if we include data from the August and November 2010 elections, the 4 year period from 2007-2010 saw an average of 135.25 new school operating levies per year, far below the 230.25 average found from 2003-2006 in the ETPI report.
Finally, according to the Innovation Ohio report, there have been 498 new school operating levies from May 2011 through the most recent election, and Governor Kasich’s term is likely to see more new operating levies than Governor Strickland’s. But even these numbers can be deceiving when taken out of the broader historical context. For example, there would have to be over 200 new levies in the upcoming August and November elections for the average number of new levies during the first Kasich term to hit the average seen during the second term of Governor Voinovich, and nearly double the previous three years for the Kasich average to hit the high seen during the second term of Governor Bob Taft. Thus, barring a catastrophic event, the 14 percent increase in levies seen between the Strickland years and the Kasich years, won’t come close to the 140 percent increase seen between the two Taft terms.
The available data does not allow for grand conclusions, but it is safe to say that the 14 percent increase in new operating levies over the past four years is not particularly surprising when taken in context. And although new tax burdens are never to be ignored or taken lightly, this recent rise is still well within the scope of Ohio’s new-levy average over the past 15 to 20 years.